Blog
Geography of events on Twitter #TDF #BRAv#GER

9th July 2014
Teachers can follow @TwitterData on Twitter to see events that are being tweeted about and the locations from which these events are being sent. This can be brought into a fun classroom activity. Teachers can give the date of an event and the location of most tweets and students have to guess the event. For example on The 6th of July what event had Sheffield/York lighting up in terms of Tweets?
This of course was the second stage of the Tour de France. The twitter map is below.
Another Question: The most tweeted event in Twitters history took place on the 8th of July. What was this event?
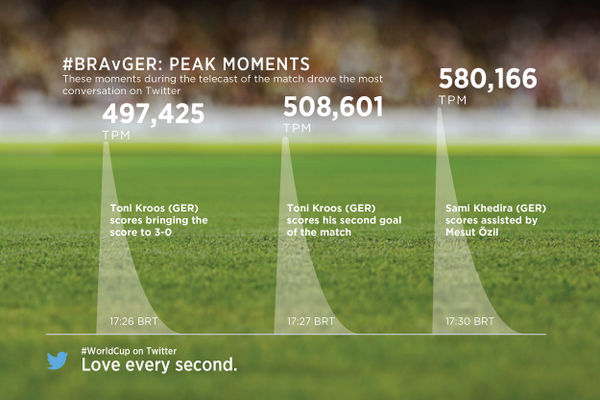
It was of course the Brazil Germany world cup semi-final which broke the record for most tweeted event ever and the most tweets per minute for any event.

Students can examine where in the world people where tweeting about this event and the map below shows how tweets increase in relation to the important events i.e. goals in the map below. All maps from @TwitterData can be embeded and republished.