Study Notes
State of the UK Economy (May 2018)
- Level:
- AS, A-Level, IB
- Board:
- AQA, Edexcel, OCR, IB, Eduqas, WJEC
Last updated 4 Jul 2018
Here is our regular update on key indicators for the UK economy as we focus on the state of play for the UK two years after the Brexit vote and eight years on from the end of the recession.
Resilient or fragile?
Eight years after the trough in output following the Global Financial Crisis, the UK economy is slowing down. Demand, output and jobs have been resilient in the two years since the June 2016 Brexit vote – the economy did not “fall off the cliff” as many feared. And the strength of the labour market has been a notable achievement for the Government. But there are now growing signs of a softening in growth in the UK even though the world economy is picking up quite strongly. How much further does the expansion in output have to go before risks of recession emerge once more. In 2018 Britain will be one of the slowest-growing, if not *the* slowest-growing economy in the G20.

GDP growth is softening
Having taken five years for GDP to recover to pre-recession levels, the latest data show that the UK economy is now 11% bigger than it was before the recession. 21 consecutive quarters of growth is a note-worthy achievement. But notice here how the annual rate of growth of real GDP has been weakening since 2014. The slowdown cannot be due entirely to Brexit-related factors.

Consumer spending
Consumer demand accounts for nearly two thirds of aggregate demand so any weakening of consumer confidence and spending has a significant impact on the economy. Confidence is softening in part because of economic uncertainties and despite the very low rates of unemployment. A number of high street stores have closed and there is pressure on profit margins in the supermarket industry reflected in Sainsbury’s bid to merge with Asda.

Low capital investment
The UK has the lowest percentage of non-government capital investment spending as a percentage of gross domestic product (GDP) across the OECD between 1995 and 2015. UK non-Government investment was14.0% of GDP in 2015, compared with 17.9% across the OECD as a whole. Low investment means that the UK’s capital stock of machinery and buildings is ageing and it is a factor behind a drop in the estimated trend rate of growth for the UK. Government sector investment is now rising after several years of austerity but there is a substantial infrastructure backlog to address.

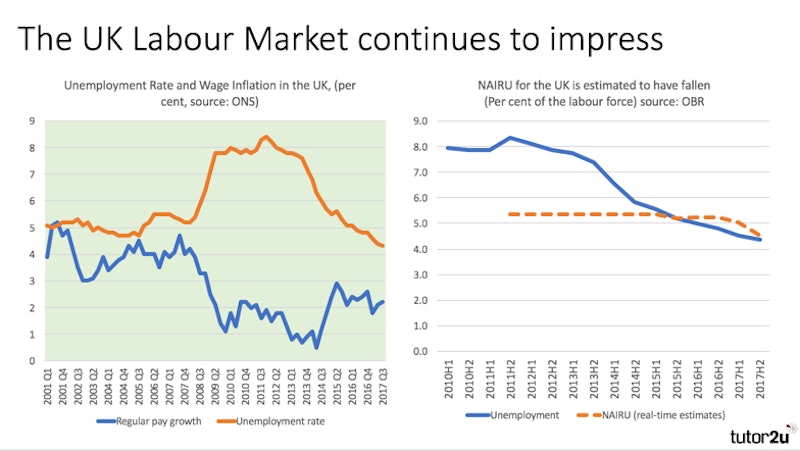
Unemployment is now at a 43 year low
Unemployment dropped to 4.2% of the labour force in Feb 2018, 1.4 million people
Youth unemployment has declined from 20% in 2012 to 12% in 2018 (equivalent to 520K people aged 16-24)
Long-term jobless rate also declining to 1.1% of labour force (less than 25% of total jobless)
However … dig underneath the data:
- High levels of economic inactivity
- Under-employment remains a major factor - where workers stay in part-time, temporary or zero-hours contract roles because they cannot access full-time jobs - Under-employment estimated to be above unemployment
- Declining median real wages and also many people who have a job experience in-work poverty and continue to rely on benefits
The labour market – on the surface – is a shining light in recent macroeconomic performance. The LFS measure of unemployment is now at the lowest level since the mid 1970s and employment is at a record high. We have seen a sustained fall in unemployment without it triggering an acceleration in wage and consumer price inflation. It seems as if the Phillips Curve has flattened and shifted inwards so that the British economy can operate at a higher level of employment without inflation picking up. Both the Bank of England and the OBR recently lowered their estimated NAIRU – shown in the chart.

Evaluation points on 40 year low for UK unemployment
Still significant regional variations in unemployment rates
Debate over quality of jobs rather than the quantity
- Zero hours contracts – the rise of the precariat
- Low pay, many reliant on in-work benefits
- Shift work. Unsocial hours, work-life balance
- Uncertain levels of under-employment
Barriers to getting structurally unemployed into work:
- Housing shortages / expensive rents
- Costs of child care / transport
- Skills shortages /pattern of employment is constantly changing
Inflation
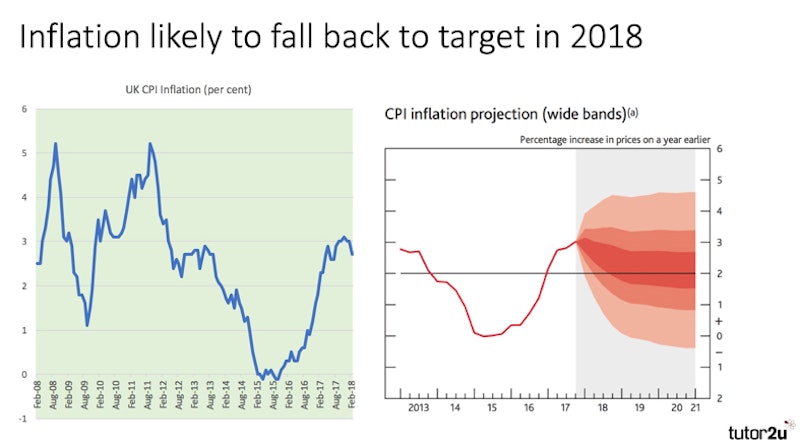
Fall in inflation is being helped by an appreciation in the external value of the pound.

Government borrowing and the national debt
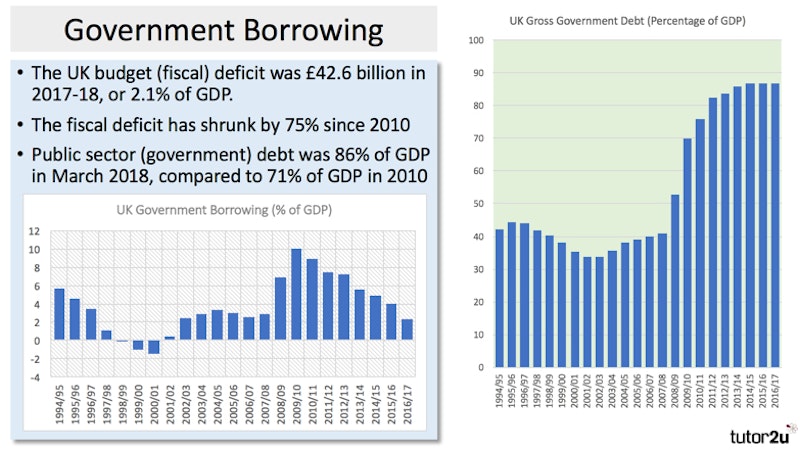
The UK budget (fiscal) deficit was £42.6 billion in 2017-18, or 2.1% of GDP.
The fiscal deficit has shrunk by 75% since 2010
Public sector (government) debt was 86% of GDP in March 2018, compared to 71% of GDP in 2010

Current Account Balance
UK ran a record deficit of 5.6% of GDP in 2016. In 2017, the deficit came down to 4.1% = £82.9 billion
- UK trade deficit in goods: £136 billion
- UK trade surplus in services £107 billion
- UK trade balance in goods & services -£29 billion
Current account deficit was amplified by a deficit in primary income (investment income) and secondary income (transfers)
Great stats here from Ian Stewart at Deloitte!
The UK has run a deficit on trade in goods and services for 52 of the last 70 years and every year since 1998. The lion’s share of the deficit is concentrated on trade with Germany, China, Spain, Belgium, the Netherlands and Norway. In 2016 the UK ran trade surplus with 67 countries, including the US, Ireland, Switzerland, the United Arab Emirates, Saudi Arabia, Australia and Brazil.
Some structural weaknesses in the UK economy
Low capital investment
- Private + Public Investment = 17% of GDP in 2016
- Policy response: Corporation tax falling to 18% in 2020
Infrastructure reaching capacity / ageing capital stock
- UK ranks 31st in world for broadband speeds,
- London airports are forecast to reach full capacity by 2034, Heathrow operates at > 98% capacity
- World Economic Forum ranks quality of Britain's infrastructure 24th in the world (19th in 2006)
- Policy response: HS2, road-building programme, more funding for housing, Transforming Cities fund. CrossRail close to completion
Skills gaps in the labour market / continued high levels of economic inactivity
- 800,000 unfilled vacancies in the labour market
- Shortfall of people with STEM (science, technology, engineering & mathematics) skills
- UK lagging behind in adult literacy
- Policy responses:
- Reforms to vocational education including the new “T” Level qualifications
- Apprenticeship Levy to get more firms to make a financial contribution to training
- Relaxing rules on skilled immigration
Chronic under-supply of affordable and energy efficient housing
- New house-building well below the 250,000 per year needed to meet changing/growing needs
- Rising house prices & rents and serious affordability problems for young people
- Relaxation of planning laws
- Cutting VAT on developing brownfield land, taxes on land that is not developed where planning permission exists
You might also like
Rostow's Five Stages of Economic Growth Model
Study Notes

Meet the UK Interest Rate Setters!
13th September 2015
Productivity differences between large and smaller firms in the UK
11th January 2016

We are much better off than the official statistics say
16th March 2016
The Pattern of UK Trade
Topic Videos

Brexit so far - in 5 charts
9th December 2016
Daily Email Updates
Subscribe to our daily digest and get the day’s content delivered fresh to your inbox every morning at 7am.
Signup for emails