In the News
The World in Economic Transition

10th July 2017
Here is a clear infographic showing the changing balance of world GDP between different groups of countries.
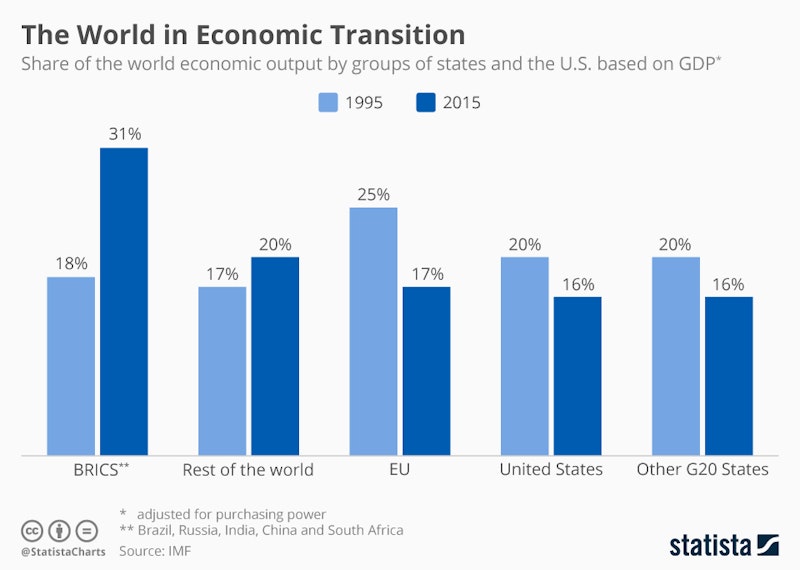
Adjusted for purchasing power parity, the EU's share of world output has declined from 25% in 1995 to 17% in 2015 whereas the share of the BRICs nations has grown from 18% to 31% over the same period.
Geoff Riley
Geoff Riley FRSA has been teaching Economics for over thirty years. He has over twenty years experience as Head of Economics at leading schools. He writes extensively and is a contributor and presenter on CPD conferences in the UK and overseas.
You might also like
China - Economic Growth and Development
Study Notes
Can poorer countries follow China's growth model?
15th May 2015
Global Economic Forecasts for 2016
1st January 2016
Chinese Trade and Investment
Topic Videos
Theme 1 Micro Knowledge: Country Examples
Study Notes
Will covid kill globalisation?
4th October 2020
Leprechaun Economics - How real is Ireland's super-fast economic growth?
19th February 2023
Daily Email Updates
Subscribe to our daily digest and get the day’s content delivered fresh to your inbox every morning at 7am.
Signup for emails